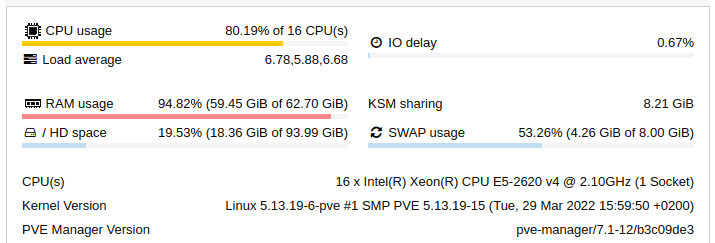
If Proxmox runs out of RAM on the host, some VMs might suddenly just be switched off. This article has a few tips to see when this happens and where to look in the log files. The general rule of thumb is never let your host run out of RAM so try to always monitor the RAM usage. Here is an example of high RAM usage:
To see the result of a VM shutdown, tail /var/log/syslog. Below we will show two scenarios of a log file (post shutdown).
The first one:
Mar 25 02:11:39 proxmox1 kernel: [38030728.043642] kvm invoked oom-killer: gfp_mask=0xcc0(GFP_KERNEL), order=0, oom_score_adj=0
The second one:
Sep 21 16:59:43 proxmox1 QEMU[2057567]: kvm: terminating on signal 15 from pid 1086 (/usr/sbin/qmeventd)
Sep 21 16:59:44 proxmox1 kernel: [13079587.474981] fwbr113i0: port 2(tap113i0) entered disabled state
Sep 21 16:59:44 proxmox1 kernel: [13079587.505845] fwbr113i0: port 1(fwln113i0) entered disabled state
Sep 21 16:59:44 proxmox1 kernel: [13079587.505950] vmbr0: port 10(fwpr113p0) entered disabled state
Sep 21 16:59:44 proxmox1 kernel: [13079587.506062] device fwln113i0 left promiscuous mode
Sep 21 16:59:44 proxmox1 kernel: [13079587.506064] fwbr113i0: port 1(fwln113i0) entered disabled state
Sep 21 16:59:44 proxmox1 kernel: [13079587.534504] device fwpr113p0 left promiscuous mode
Sep 21 16:59:44 proxmox1 kernel: [13079587.534509] vmbr0: port 10(fwpr113p0) entered disabled state
Sep 21 16:59:45 proxmox1 qmeventd[2819432]: Starting cleanup for 113
Sep 21 16:59:45 proxmox1 qmeventd[2819432]: Finished cleanup for 113
Sep 21 16:59:45 proxmox1 systemd[1]: 113.scope: Succeeded.
Sep 21 16:59:45 proxmox1 systemd[1]: 113.scope: Consumed 1d 12h 8min 18.911s CPU time.