Table of Contents
How to monitor disk performance iowait on Linux
Description
When your hard disk run slow, your entire system slows down. So it figures the key to monitoring performance on any server implies monitoring the disk. Linux comes with a number of tools to assist with this operation, and this article aims to present some of the most common utilities, and some common use cases.
The Definition of IO Wait Time
To understand disk performance in Linux one has to understand what’s called io wait time. The quickest way to see IO Wait time is to use the top utility.. Referring to the diagram below, you will notice 1.3 wa This is the IO Wait Time. Although it seems a bit obscure as it’s referring to IO, it’s really just saying “How long must an idle CPU wait for the disk I/O to complete.“. The caveat is it’s not only waiting for the disk – the entire “IO” subsystem might be playing a role. As a rule of thumb though, you don’t really want more than 1.0.
![]()
top is one of the first tools that you reach for when checking to see if a disk is running at maximum or degraded performance and it’s universal, so learn to use it.
Historical Statistics
It’s all fine and dandy seeing what’s happening right now, but what if you needed to see historical statistics? In this article we provide a few ways os testing, some utilities, and the SNMP method.
FIO
Fio is our favourite as of July 2023. Fio has many options but can do a really grand 1 Gigabyte file test and show you what’s currently happening.
This is the command we prefer:
fio --randrepeat=1 --ioengine=libaio --direct=1 --gtod_reduce=1 --name=test --filename=random_read_write.fio --bs=4k --iodepth=64 --size=1G --readwrite=randrw --rwmixread=75
This will write a 1 GB file. Remember to delete it.
Benchmarks? Let’s show you some that we got:
- Oldish HP Laptop with local SSD: 7 seconds
- Host in SA, 3 seconds
- Dedicated server in SA, 7 seconds
- Mirror 1 server in SA, 39 seconds.
- Random AWS server with HyperV and bare metal: 16 minutes
- Low powered Supermicro Proxmox with ZFS over iSCSI via TrueNAS, 7 minutes
- Random host in SA, 7 minutes
- Random host in Germany, 3 seconds
As you can see times are from 3 seconds to 16 minutes. Does this means everything else is slow? It’s quite possible but sometimes perception is worse (or better) than reality.
Script
Fio for all it’s power doesn’t actually clearly show the total time spent so we’ve created the ultimate script to keep track of disk speed tests.
The script relies on fio:
sudo apt install fio
Below is the ultimate disk speed test Bash script, last updated 28 March 2025. See the end of this article for some good results.
#!/bin/bash

# Capture the optional input parameter, if provided
input_param=$1

# Start timer to measure disk speed (in nanoseconds)
start=$(date +%s%N)

# Run fio and capture the output
fio_output=$(fio --randrepeat=1 --ioengine=libaio --direct=1 --gtod_reduce=1 --name=test --filename=random_read_write.fio --bs=4k --iodepth=64 --size=1G --readwrite=randrw --rwmixread=75 2>&1 | tee /dev/tty)

# Remove the temporary test file
rm random_read_write.fio

# End the timer (in nanoseconds)
end=$(date +%s%N)

# Calculate the time difference in nanoseconds
duration_ns=$((end - start))

# Convert duration to seconds and milliseconds
duration_s=$((duration_ns / 1000000000))
duration_ms=$((duration_ns / 1000000))

# Get current date and time in the format YYYY-MM-DD h:i:s
current_datetime=$(date '+%Y-%m-%d %H:%M:%S')

# Extract the read and write lines from fio output
read_line=$(echo "$fio_output" | grep "^ *read:")
write_line=$(echo "$fio_output" | grep "^ *write:")

# Extract the relevant values from the read line
read_iops=$(echo "$read_line" | grep -oP "IOPS=\K[^\s,]+")
read_bw=$(echo "$read_line" | grep -oP "\(\K[^\)]+MB/s")

# Extract the relevant values from the write line
write_iops=$(echo "$write_line" | grep -oP "IOPS=\K[^\s,]+")
write_bw=$(echo "$write_line" | grep -oP "\(\K[^\)]+MB/s")

# Prepare the result string
if [ -n "$input_param" ]; then
result="$current_datetime The disk speed test took $duration_ms milliseconds on $input_param to complete / read: IOPS=$read_iops ($read_bw) / write: IOPS=$write_iops ($write_bw)"
else
result="$current_datetime The disk speed test took $duration_ms milliseconds to complete / read: IOPS=$read_iops ($read_bw) / write: IOPS=$write_iops ($write_bw)"
fi

# Output a blank line
echo

# Append the result so that a history is kept
echo "$result" >> speed-results.txt

# Display the results
cat speed-results.txt
On FreeBSD skip the --ioengine parameter.
Sample outputs
| Description | Read | Write | Time |
|---|---|---|---|
| Single NVMe | 101MB/s | 33.6MB/s | 19 |
| Host SSD Raid | 115MB/s | 38.4MB/s | 17 |
| RAID 5 + Cache on TrueNAS | 20 | ||
| RAID 5 Magnetic | 6028kB/s | 2014kB/s | 148 |
SAR
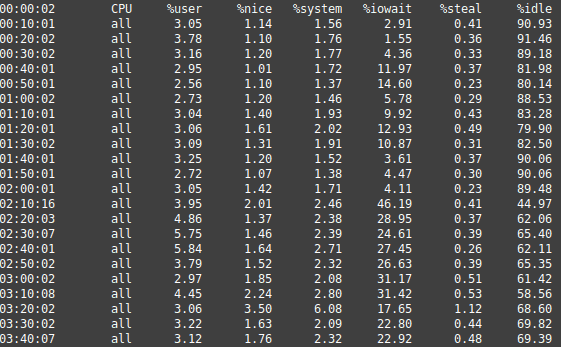
SAR stands for System Activity Report and keeps track of historical system data, including CPU and disk I/O. To use the actual utility, just type sar. When you run sar, you will get historical statistics up to 10 minute minute intervals of your system that goes back to the start of the day. In the screenshot below, you will see sar output. What’s notable about the output are the spikes of 11, 14, 12, and 10. Then at 2AM an actual backup kicks off, and you see a dramatic increase in the disk I/O wait time.

At this point you might ask what is a normal range for Disk I/O wait time? In our experience, anything from 1 to 5 is normal, 10 starts getting slow, 20 is really slow, and anywhere above 20 is really very slow. These values are a bit relative though and we recommend checking your system on a regular basis to determine baselines, and experimenting with backups or the du command to test some limits. Leave us a comment to tell us what you think is normal for your system.
Installing SAR
If you’re system doesn’t have sar, then do this for Ubuntu/Debian:
apt install sysstat
Next change ENABLED=”false” to ENABLED=”true” in /etc/default/sysstat
Then
service sysstat restart
The SNMP Method
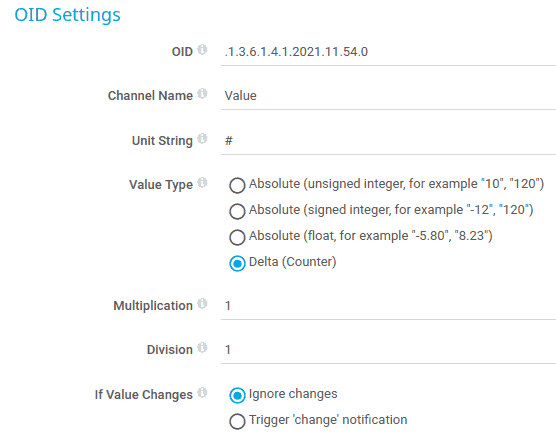
It turns out SNMP can also monitor system IO stats. To monitor exactly iowait time, use this OID but be sure to specify delta values instead of absolute values.
.1.3.6.1.4.1.2021.11.54.0
To test:
snmpwalk -v 1 -c your_community localhost 1.3.6.1.4.1.2021.11.54.0
Example of PRTG Configuration specifying Delta instead of Absolute.

Other Utilities and more SNMP
Two other notable utilities for monitoring that includes disk performance monitoring are iostat and the cat /proc/diskstats command. If your CentOS system doesn’t have iostat install, install it so yum install iostat
iostat
iostat has the handy d flag which allow you to continuously monitor the output, for example below every two seconds:
iostat -d 2 %iowait
If you don’t have iostat on your Ubuntu rig, do this:
sudo apt install sysstat -y
cat /proc/diskstats
/proc/diskstats is used by the handy Perl script for Webmin, called Webminstats, which draws fairly comprehensive RRD data of disk operation. Here is a snippet from that Perl code:
my $module_name;
my $info  = '<strong>/proc/diskstats</strong>';
my $EMPTY = EMPTY();

###############################################################################
# ask the system info on file system
sub read_data() {

	my $r_tab = read_full_file($info);
	my @res   = @{$r_tab};
	return @res;
}
More Disk SNMP Monitoring
If you’re looking for more general SNMP monitoring of disk activity, use the following OID:
snmpwalk -v 1 -c your_community localhost 1.3.6.1.4.1.2021.13.15.1
So What’s Causing the Slow Disk
The aim of this article is just to help you determine your disk is slow. To see what’s actually slowing it down, takes more work. As a starting point we generally recommend top, and looking at the top processes by CPU to see what is busy. If you are running a web server, this only paints part of the picture, you might have to go deeper under the hood with netstat to see how many actual connections are made to the web server. Perhaps start gracefully terminating the processes one by one to see if ‘WA’ recovers.
Conclusion
Disk I/O Monitoring is key to performance. Be sure to know what you’re dealing with. If you are working with many disks, graph the data to compare workload surges and ensure they are moved away if they affect other areas.
History of Good Disk Speed Results
Additional statistics provided by one of my all time favourite softwares, HDSentinel!
https://www.hdsentinel.com/hard_disk_sentinel_linux.php
3881 ms
2025-03-28 13:03:02 The disk speed test took 3881 milliseconds to complete / read: IOPS=142k (582MB/s) / write: IOPS=47.5k (195MB/s)
Operating parameters
Config: Single drive (no RAID), EXT4 (df -T)
Host: Dell R530 (PCIe 3)
Drive bus type: PCIe-4
OS: Proxmox VE 8.3, no applications running
HDD Device 2: /dev/nvme2
NVME type: TLC
HDD Model ID : Samsung SSD 990 PRO 2TB
HDD Revision : 4B2QJXD7
Interface : NVMe
Temperature : 30 °C
Highest Temp.: 30 °C
Health : 100 %
Performance : 100 %
Total written: 40.14 GB
Comments: This was a fresh drive imported from China via buydig Store
Reliability
To see how reliable your disks are, you should use S.M.A.R.T. or HDSentinel. Pros use S.M.A.R.T. and people in a hurry use HDSentinel. Here is a curated HDSentinel script that gives me all I need:
#!/usr/bin/env bash
# apt install libxml2-utils

HDS="./HDSentinel"
TMP_XML="/tmp/hdsentinel.xml"

#######################################
# Host information
#######################################

HOSTNAME=$(hostname)

IPV4=$(ip -4 -o addr show scope global | awk '{print $4}' | cut -d/ -f1 | paste -sd "," -)
IPV6=$(ip -6 -o addr show scope global | awk '{print $4}' | cut -d/ -f1 | paste -sd "," -)
TIMESTAMP=$(date "+%-d %B %Y @ %H:%M")

echo "HOST: $HOSTNAME"
echo "IPv4: $IPV4"
echo "IPv6: $IPV6"
echo "Last updated: $TIMESTAMP"

echo

#######################################
# Generate structured report
#######################################

$HDS -xml -r "$TMP_XML" >/dev/null 2>&1

if [ ! -f "$TMP_XML" ]; then
echo "HDSentinel XML report failed"
exit 1
fi

#######################################
# Parse disks
#######################################

#######################################
# Parse disks
#######################################
DISK_COUNT=$(xmllint --xpath \
'count(/Hard_Disk_Sentinel/*[starts-with(name(),"Physical_Disk_Information_Disk_")])' \
"$TMP_XML" 2>/dev/null)

for ((i=0; i<DISK_COUNT; i++)); do
BASE="/Hard_Disk_Sentinel/Physical_Disk_Information_Disk_${i}/Hard_Disk_Summary"

DEVNUM=$(xmllint --xpath "string($BASE/Hard_Disk_Number)" "$TMP_XML" 2>/dev/null)
DEVPATH=$(xmllint --xpath "string($BASE/Hard_Disk_Device)" "$TMP_XML" 2>/dev/null)
SERIAL=$(xmllint --xpath "string($BASE/Hard_Disk_Serial_Number)" "$TMP_XML" 2>/dev/null)
SIZE_RAW=$(xmllint --xpath "string($BASE/Total_Size)" "$TMP_XML" 2>/dev/null)
HEALTH=$(xmllint --xpath "string($BASE/Health)" "$TMP_XML" 2>/dev/null)
LIFETIME=$(xmllint --xpath "string($BASE/Estimated_remaining_lifetime)" "$TMP_XML" 2>/dev/null)
WRITTEN=$(xmllint --xpath "string($BASE/Lifetime_writes)" "$TMP_XML" 2>/dev/null)
STATUS=$(xmllint --xpath "string($BASE/Description)" "$TMP_XML" 2>/dev/null)

INTERFACE=$(xmllint --xpath "string($BASE/Interface)" "$TMP_XML" 2>/dev/null)

# Map interface to short label
case "$INTERFACE" in
*NVMe*) IFACE_LABEL="NVMe" ;;
*USB/ATA*|*SAT*) IFACE_LABEL="SATA" ;;
*SAS*) IFACE_LABEL="SAS" ;;
*) IFACE_LABEL="Disk" ;;
esac

# Strip " MB" suffix and trailing spaces before arithmetic
SIZE_MB=$(echo "$SIZE_RAW" | grep -oP '^\d+')
SIZE_GB=$(( ${SIZE_MB:-0} / 1024 ))

# Strip trailing " %" from health if present
HEALTH=$(echo "$HEALTH" | tr -d ' %')

echo "${IFACE_LABEL} ${DEVNUM}: ${DEVPATH} SERIAL=$SERIAL SIZE_GB=${SIZE_GB} HEALTH=${HEALTH}% LIFETIME=\"$LIFETIME\" WRITTEN=\"$WRITTEN\""
echo "${IFACE_LABEL} ${DEVNUM}: $STATUS"

echo

done
See Also
References
- https://www.unixmen.com/how-to-measure-disk-performance-with-fio-and-ioping/
- https://serverfault.com/questions/12679/can-anyone-explain-precisely-what-iowait-is
- http://veithen.io/2013/11/18/iowait-linux.html
- https://thwack.solarwinds.com/t5/SAM-Discussions/Linux-Disk-IOPs-with-SAM/m-p/342972
- https://docs.cpanel.net/knowledge-base/general-systems-administration/how-to-troubleshoot-high-disk-io-problems/
man iostat- https://stackoverflow.com/questions/45725414/cannot-open-var-log-sysstat-sa16-please-check-if-data-collecting-is-enabled-in