Background
A fairly complex server has been misbehaving. This has been ongoing for a few weeks. The problem was been hard to isolate because the server is generally quite busy. It’s a Virtualmin server with lots of websites and we don’t have specific control over the mostly WordPress websites.
Over time we can see memory depletion and then swap depletion. Eventually things come to a grinding halt. This happened a few times, but in general we knew something was amiss when the client contacted us and told us some of their users are complaining about slow websites.
We had a number of monitors on this server, specifically CPU and RAM. The “SNMP Linux Meminfo” monitor on PRTG is quite sensitive, so we’ve also added individual “SNMP Memory” monitors which splits them out nicely. I like this monitor because I can quickly see how much actual physical RAM is available over time. We also added an IO/Wait time custom OID of 1.3.6.1.4.1.2021.11.54.0. This is probably one of the most powerful monitors when it comes to performance.
All these monitors helped, but the most telling clue was the system IO/Wait time “WA” value that can be seen with the top command. This value should never be above 1.0. IO / Wait according to man is “time waiting for I/O completion.”. So by observing the “WA” value for a short while we could see the server is having serious strain.
Over the last few weeks we have been fine tuning this server. We’re in a fortunate situation that we can easily add CPU and RAM as it’s running on our VPS infrastructure. Disk is more tricky, but we knew the server should be doing great because it’s using SSD and the array is very clean.
Finally today I managed to isolate the problem, with the help of the client. It turns out it’s not CPU or RAM, although adding more RAM helped (it bought some time).
In summary what we were dealing with was a database race condition slowing down the server.
The first very big clue was in Virtualmin, when you click on the Memory dial on the Dashboard you can see and sort memory usage by site.
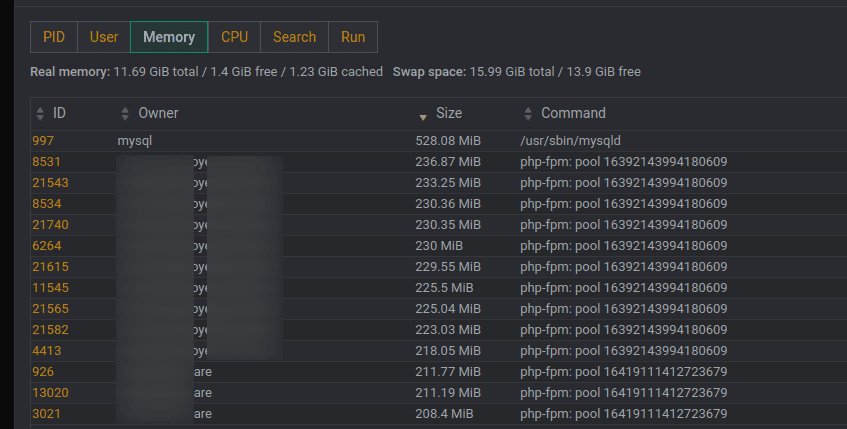
The site owner was clear that the largest uptaker of memory was not a busy site. She already had Google Analytics on the site and could confirm the site actually only gets a few users per day.
The next telling clue was tailing the Apache log file in /home/site/logs/access.log
Here is a new thing pop up: We noticed that the site is repeatedly hitting itself, using lines similar to the following:
a.b.c.d - - [03/Apr/2023:12:22:41 +0200] "POST /wp-admin/admin-ajax.php?action=as_async_request_queue_runner&nonce=3ebb7b0a59 HTTP/1.1" 200 5929 "-" "WordPress/6.2; https://example.com"
Note ‘as_async_request_queue_runner‘? Not entirely easy to find information on it, but basically this is the built-in process of WordPress that is supposed to be doing Ajax requests in the background. It actually has an entire interface that’s not visible within WordPress. This interface can be opened by appending your WordPress URL with this:
wp-admin/tools.php?page=action-scheduler&status=pending&order=asc
At some stage the site owner pointed out that All in One SEO had warning flash up on the screen – something to do with pending tasks.
Now we had a lot of tangible information, the next steps in the isolation process were:
watch -n1 'mysql -uroot -e "show full processlist"'
This watch command allowed us to see that some specific sites were causing database locks. By looking at both the watch command and a top command we could also see MySQL frequently above 100%. Another telling clue that there is something wrong on the server. By combing carefully looking at the processlist we identified that these locks cause 100% CPU, starting off the race condition.
Back in our hidden action scheduler URL we noticed 600K pending items on one of the websites, and 800K pending items on another one of the websites for All in One SEO.
What basically happens here is All in One SEO is trying to update something in the background, but fails. This items gets stored in the queue. All in One SEO then launches a new process, which also fails. This goes on and on and eventually the table grows so large and inefficient that the whole MySQL process on the server becomes a performance problem.
By this time more telling clues came to the foreground. Specifically we noticed the low usage website’s database was almost 500MB, which is ludicrous for a small WordPress website that hardly ever gets accessed.
Since the WordPress interface can only go up to displaying 999 items at a time, and is excruciating slow, we decided to get rid of the pending items using database queries. Here are the queries we used:
delete from database_name.wp_actionscheduler_actions where hook='aioseo_search_statistics_objects_scan' and status = 'pending';
This only partially got rid of the problem. It appears that there is also a log file and this was huge. I don’t approve of this query, but this is how we managed to clear that log file:
delete from database_name.wp_actionscheduler_logs where message = 'action created';
Finally, after weeks of isolation processes, we managed to fix the performance of the server.
Update 12 May 2023
On 12 May we had another server with a race condition. In this instance it wasn’t clear cut what was the culprit, most certainly not WP All in One SEO. This server has 15 million records in the actions scheduler and brought down many other workloads on the same server. In order to get past this problem we had to choose a date in the past, and the gradually start deleting records. This is the query we used:
delete from wp_actionscheduler_actions where status = 'complete'and scheduled_date_gmt < "2023-05-02";
Compacting the Database Afterwards
Since deleting millions or 100s of thousands of records will leave a database fragmented, you want to compact the space. You might also notice after deleting 100s of thousands of records that the space of the file doesn’t shrink – another reason to compact.
To compact the space of the database depends if you’re using MyISAM or the other one.
The basic commands are:
USE your_database_name;
Then
OPTIMIZE TABLE your_table_name;
Carefully look at the output to see if it worked.
Summary of Lessons Learnt
- When reaching for
topand investigating performance, look at ‘wa’ first - 100% CPU on MySQL is a problem
watchand the MySQLshow processlistcommands are a great combination to see repeat problematic queries- Know how to interpret log files – your server posting to itself all the time is a problem
- Be on the lookout for abnormally large databases
- Observe abnormal amount of memory processes (in relation to busy or non-busy sites)
- Work closely with your client. I don’t think we would have easily solved this problem without the express help of the client.
Other
The client also informed us by upgrading a number of sites to the latest PHP helped for performance.
Finally, unfortunately by deleting 100s of thousands of records, we also left the database fragmented.
That’s a tale for another article.