Background
On a small Virtualmin server without many domains you won’t noticeably see CPU spikes every 5 minutes. But the larger your servers gets, and the more domains, and the bigger log files become, the more this will be noticable. What I am talking below is the following pattern:
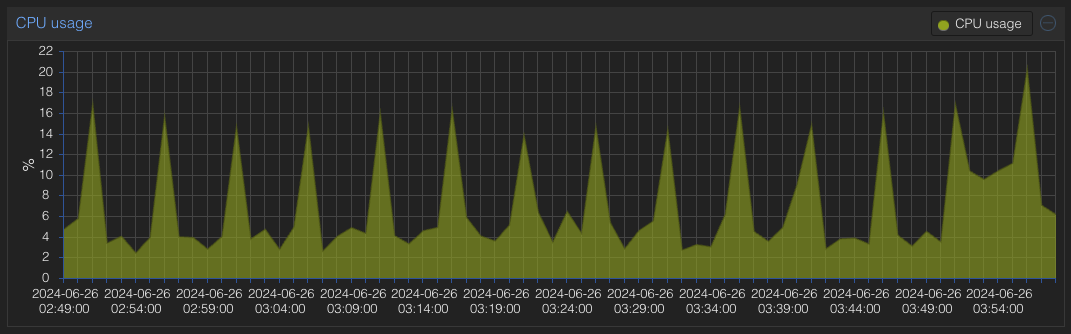
In most situations you can just leave it. But on extremely large servers, I’m talking over 200 email domains, many active websites running WordPress and WordFence, and where you have already assigned many resources, you might want to contain it. The server example I am using has 24 GB RAM and a 20 GB swap file and 9 vCPUS. Hint: It’s not the one in the graph.
There is good information on the Virtualmin forums and especially this post has a lot of good information on how to contain it:
https://forum.virtualmin.com/t/collectinfo-pl-frequency/113069/2
To quote the developer:
Yes, a key collect_interval on /etc/webmin/virtual-server/config file can be change manually but re-check config must be run to have interval being updated.
However, you will see that the user in question tried changing this but still had issues.
We also concluded this is the setting to change, as per the developer again:
Then you’re looking into different collection. Have a look at Webmin ⇾ Webmin Configuration: Background Status Collection page.
and this:
Collection interval must be an integer between 1 and 60, otherwise it would make more sense to simply disable it.
Or even this:
Also, you could go to Webmin ⇾ Webmin Configuration: Webmin Scheduled Functions page, click on the cron job and set an interval with specific times.
For this large instance, we changed both values to 30 minutes and restarted webmin.
From then off on, these spikes only happened every 30 minutes.
FAQ
What functionality are we losing?
Answer: I don’t know, but performance optimization was priority so therefor this will rest for now.
How can you further optimize a large server?
Apart from running on NVMe or SSD, you can also check your fail2ban logs. If you have many already banned messages, you’ll need to give that attention. In some cases, simply restart firewalld does the job. In other cases, manually banning aggressive dictionary attackers will be the way to go.